The poor man's monitoring approach
Table of Contents
-*- mode: org -*-
1 Open source load testing tools
Open source load testing tools come in a variety of flavors. JMeter is probably the most popular one. There is Grinder, SoapUI, …. , you name it. And even some hidden treasure like erlang based Tsung.
2 Deficiencies
Most tools concentrate on the generation of load. On injecting a meanigful workload into the system under test in an efficient way. And on the ease of creating the scripts that in turn create the work load. Two aspects of load testing are generally treated in a more casual way. The monitoring of components in SuT as well as the reporting on the results of a load test are typically weaker points of open source load testing solutions. Needless to say that these are the areas where commercial solutions excel.
3 Monitoring for Dummies
We want to outline a pragmatic approach to monitor arbitrary systems with a wide range of metrics and report on the results in a simple way.
3.1 What do we need?
- An agent to gather metrics: take the current ServerAgent-2.2.1.zip from https://jmeter-plugins.org/wiki/PerfMonAgent/
- A small job to acually request and harvest the information: ~ 20 LoC of AWK
- An easy way to visualise the data: enter plotly.js
3.2 How do we proceed?
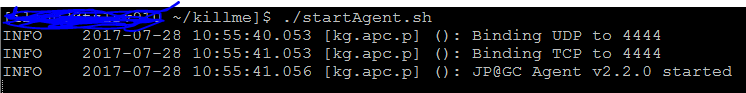
The agent is a small wrapper around the Sigar library and offers cross platform (!) access to around 75 low level metrics. Let's start the agent on a machine we want to monitor. All it needs is a java runtime environment. Not root access required.
Now let's actually tell the agent to do something meaningful. The protocol used by the PerfMonAgent is quite simple. A wireshark capture shows what is going on.
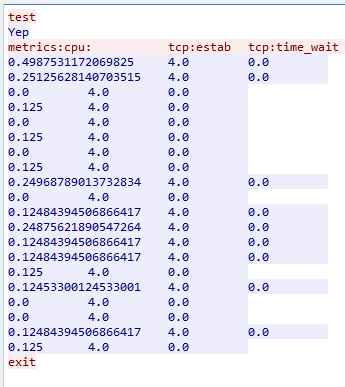
Some comments on the protocol: The client shouts "test" at the agent and expects "Yep" as the answer. The client then lists the metrics of interest. At regular intervals the client asks for the metrics. That's all.
We can use a small awk script to implement the protocol, to request and harvest metrics.
#!/usr/bin/awk -f

BEGIN {
  OFS=",";
  NetService = "/inet/tcp/0/your.target.server/4444"
  metrics="metrics:cpu:	tcp:estab	tcp:time_wait	memory:	exec:/bin/sh:-c:free | grep Mem | awk '{print $7}'";
  print "test" |& NetService
  NetService |& getline
  print "timeStamp","elapsed","label";
  print metrics |& NetService
  split(metrics,labels,"\t");
  while ((NetService |& getline) > 0) {
      split($0,measures,"\t");
      now=strftime("%Y-%m-%d %H:%M:%S");
      for (i=1;i<=length(labels);i++){
	  print now,measures[i],labels[i];
      }
      system("sleep 5");
  }
  close(NetService)
}
We choose awk as a language to highlight the raw simplicity of this type of monitoring. Of course you are free choose any language to access the agent. The protocol is simple and text based. Any language that handles tcp connections will do.
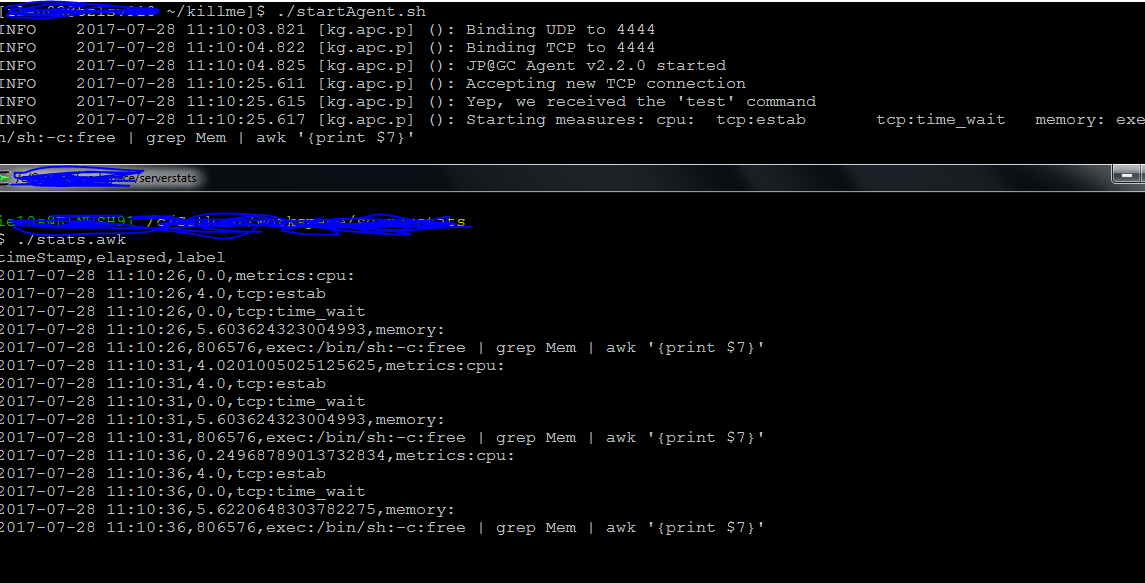
Let's start our script and see what happens.
<script src="https://cdn.plot.ly/plotly-latest.min.js"></script>
<script>
      function draw(source,title, obs) {
  Plotly.d3.csv(source, function (err, rows) {
    function unpack(rows, key) {
    return rows.map(function (row) { return row[key]; });
    }

    var layout= {
    showlegend: true,
      title : title,
    titlefont: {
    family: 'Courier New',
      size: 18,
    },

    xaxis: {
    title: 'Time',
    titlefont: {
    family: 'Courier New',
    size: 18,
    color: '#7f7f7f'
    }
    },
    yaxis: {
    title: '[depends on metric]',
    titlefont: {
    family: 'Courier New',
    size: 18,
      color: '#7f7f7f',
    tickformat : "%8.2f"
    }
    }
    };

    var data= unpack(rows,'label').filter((v, i, a) => a.indexOf(v) === i).map(function(v,i,a){return{
    x: unpack(rows.filter(function(row) {return row.label==v;}), 'timeStamp'),
    y: unpack(rows.filter(function(row) {return row.label==v;}), 'elapsed'),
    name: v ,
    type: 'scatter' } });
    Plotly.newPlot(source, data, layout);
  });
  }
</script>
<div id="serverstats.csv" style="width: 1200px; height: 600px;"></div>
<script>draw("serverstats.csv","Selected Statistics","")</script>
We simply pipe this information into a file for later use. We can use the plotly library to visualize the data. The crucial part of our report is the javascript that visualizes the csv.data.
3.3 What do we get?
The report then looks like:
Tipp: disable the exec:… metric to see that there is actually some movement in chart.
3.4 Where do we go from here?
We can gather a wide range of metrics on a wide range of HW/OS platforms. If nothing else helps we can execute arbitrary commands to gather information. The approach is easyly customizable (loop over server, change metrics). The approach is flexible and easily embedded in other reporting frameworks. Last but not least this type of monitoring and reporting can be integrated into the JMeter Dashboard logic. This way you get the JMeter Dashboard enriched with a wide range of low level OS metrics on any number of servers all for free.
4 Outlook
- Integrate the monitoring into the JMeter dashboard: http://jmeter.apache.org/usermanual/generating-dashboard.html
- Integrate the monitoring into standard test invocation
Have fun!